Speed Test
How fast is Cloudflare? Real-world speed from 4 regions
We loaded cloudflare.com from Amsterdam, Montreal, San Francisco and Singapore — 20 times each — and measured how long it actually took. Here's what real users in those cities would experience.
Independent measurement by LatencyRadar. Not affiliated with Cloudflare.
Quick take
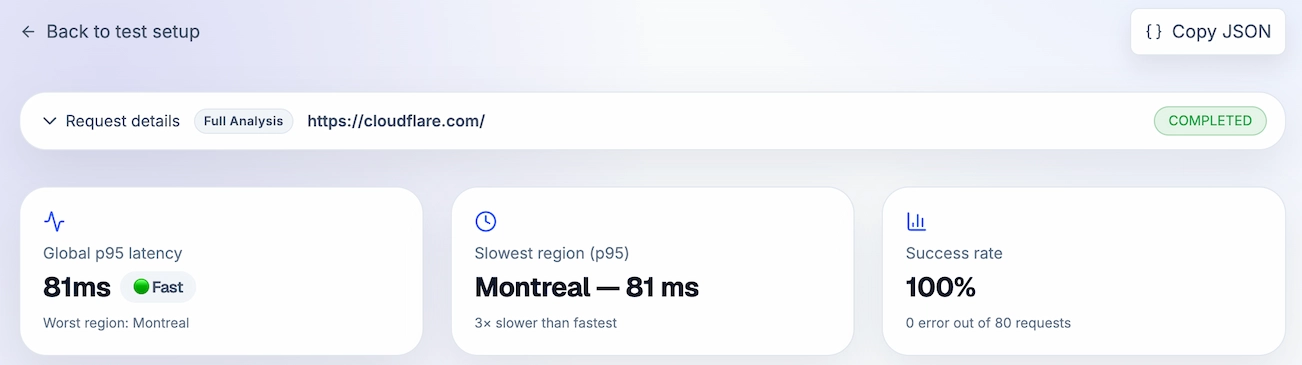
Cloudflare's homepage loaded reliably every single time, but speed varied quite a bit depending on where you are. Users in Amsterdam and San Francisco get a snappy experience around 240 ms. Users in Singapore wait more than twice as long. If your audience is global, that gap is worth knowing about.
- • Loaded successfully every single time — 80 out of 80 requests
- • Amsterdam and San Francisco users: ~240 ms load time
- • Singapore users: ~480 ms — noticeably slower
- • Most of the wait time happens on the server side, not the network
The setup
A straightforward page load from four cities, repeated 20 times each. No tricks, no warmup — just the same request your users would make. Every single one came back successfully.
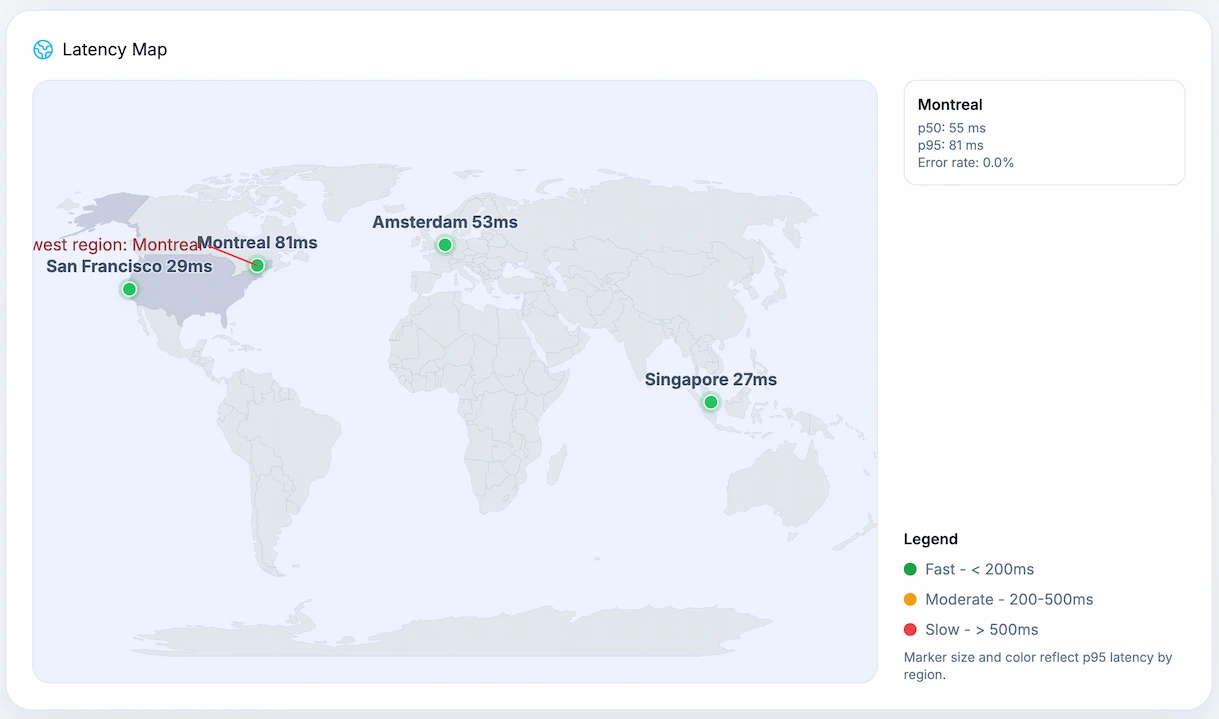
Where in the world is it fast?
Amsterdam and San Francisco had similar, fast results. Montreal was slower. Singapore was the slowest by a significant margin. If you're building something for a global audience, this kind of regional spread is exactly what you need to plan for.
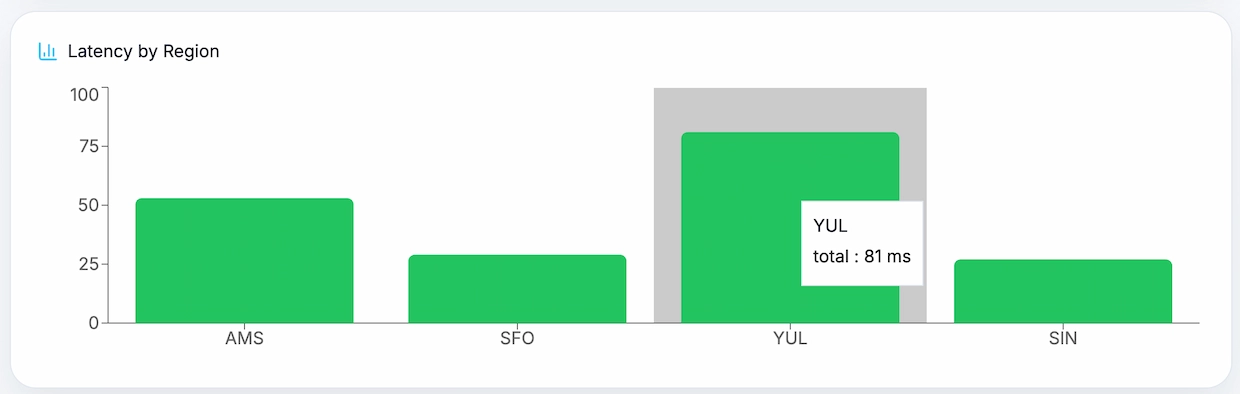
Region by region breakdown
Amsterdam was fastest at around 237 ms typical. San Francisco close behind at 244 ms. Montreal climbed to 338 ms typical, with occasional spikes past 480 ms. Singapore averaged 482 ms — more than double Amsterdam. One thing that stands out: San Francisco occasionally spiked to 688 ms, even though it's usually fast.
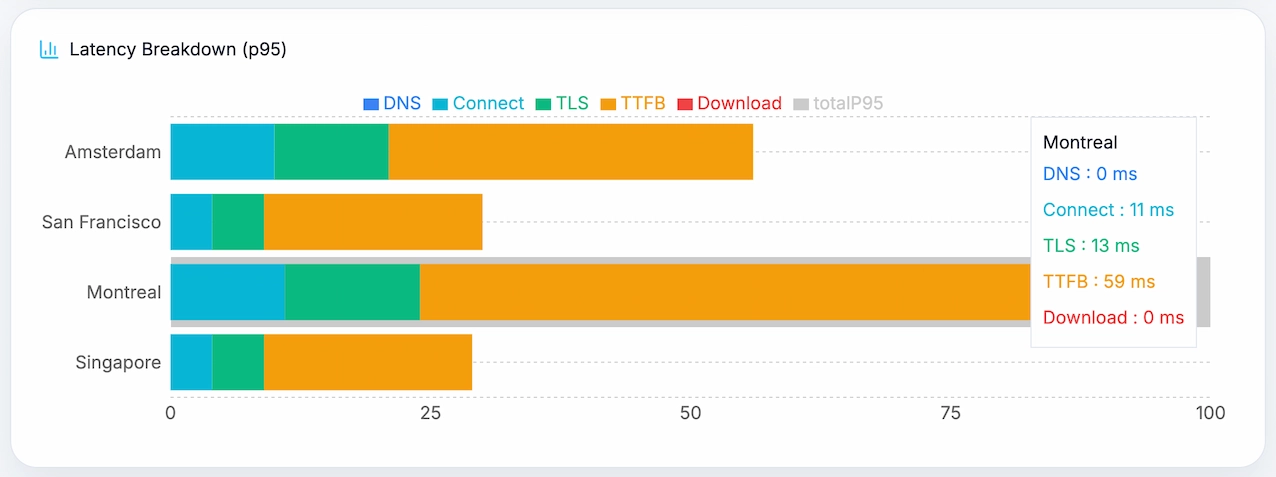
Where is the time actually going?
DNS lookup, connecting to the server, and the security handshake are all nearly instant — we're talking single-digit milliseconds. Almost all the wait time is the server preparing and sending the response. That means if you want Cloudflare to feel faster in slow regions, the answer isn't better DNS — it's getting the content closer to those users.
Region metrics
Start with the headline number for each city. Open the technical breakdown only if you want to see where that time is coming from.
Fastest region
Amsterdam
20 requests · 100% successful
On a slower request
410 ms
Worth watching
Consistency
Can spike
Rare spike: 460 ms
Biggest delay: Server responseReliability: 100%
Technical breakdown
Region result
Montreal
20 requests · 100% successful
On a slower request
487 ms
Worth watching
Consistency
Can spike
Rare spike: 557 ms
Biggest delay: Server responseReliability: 100%
Technical breakdown
Region result
San Francisco
20 requests · 100% successful
On a slower request
429 ms
Worth watching
Consistency
Can spike
Rare spike: 688 ms
Biggest delay: Server responseReliability: 100%
Technical breakdown
Slowest region
Singapore
20 requests · 100% successful
On a slower request
590 ms
Worth watching
Consistency
Can spike
Rare spike: 625 ms
Biggest delay: Server responseReliability: 100%
Technical breakdown
What stands out
- • 100% reliability — not a single failed request across all 4 regions.
- • Amsterdam and San Francisco loaded in ~240 ms — fast enough that users won't notice.
- • Singapore averaged 482 ms — users there will feel the difference.
- • Montreal was in the middle: usually fine, occasionally slow.
- • The bottleneck everywhere is server response time, not the network itself.
Why we show 'on a bad day' numbers
Average load times look great on paper but hide the slow requests that real users actually experience. We show both a typical speed and an 'on a bad day' number — that's the slowest 1 in 20 requests. If your users hit that occasionally, they'll notice. That's the number worth caring about.
How we ran this test
We made a standard page request to cloudflare.com from servers in 4 cities: Amsterdam, Montreal, San Francisco and Singapore. Each city ran 20 requests. We measured how long each step took — DNS, connection, security handshake, server response, and download — then calculated typical and worst-case times from the results.
Request type: standard page load
Cities tested: 4
Requests per city: 20
Total requests: 80
Max wait time before timeout: 20 seconds
How fast does your site load around the world?
Run a free speed test from multiple cities and find out where your users are waiting — no setup, no account required.