Speed Test
How fast is GitHub? Real-world speed from 4 regions
We loaded github.com from Amsterdam, Montreal, San Francisco and Singapore — 20 times each — and measured how long it actually took. Here's what real users in those cities would experience.
Independent measurement by LatencyRadar. Not affiliated with GitHub.
Quick take
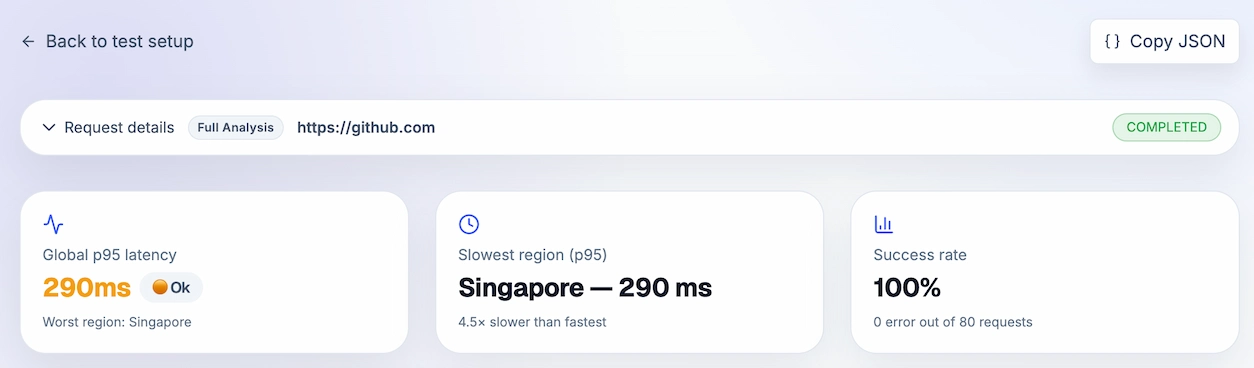
GitHub loaded successfully every single time, and for most regions it was impressively fast. Amsterdam users barely notice the request. Montreal and San Francisco are comfortable. Singapore is the interesting one: usually the fastest of all four cities, but occasionally much slower — which means the experience there is less predictable than the numbers first suggest.
- • Loaded successfully every single time — 80 out of 80 requests
- • Amsterdam users: ~63 ms — essentially instant
- • Singapore is usually the fastest city, but occasionally spikes to 290 ms
- • Most of the load time is downloading content, not connecting to the server
The setup
A standard page load from four cities, repeated 20 times each. Nothing special — just the same request your users would make. Every single one came back successfully, which is a good baseline sign.
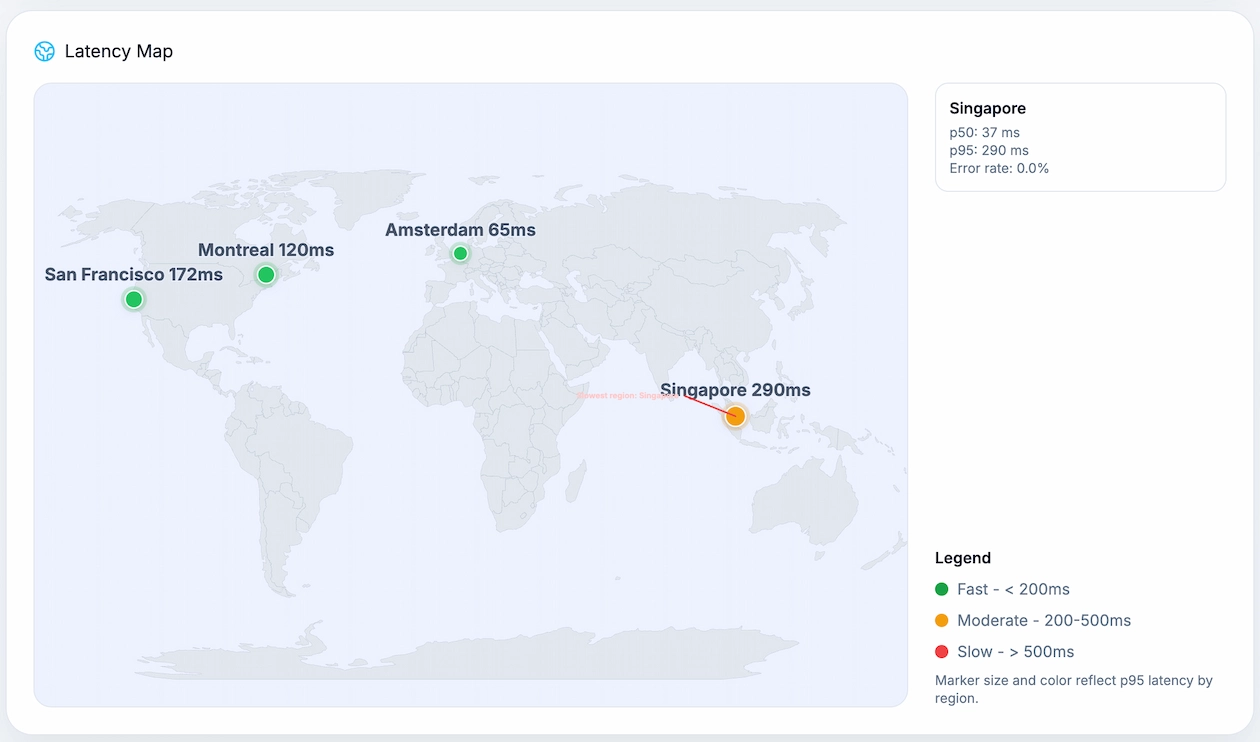
Where in the world is it fast?
Amsterdam is the clear winner for consistency. Montreal and San Francisco are steady, if slower. Singapore is the surprising one — usually the fastest city in this test, but with occasional slow outliers that stand out. If your users are in Asia, GitHub is mostly quick, but not always.
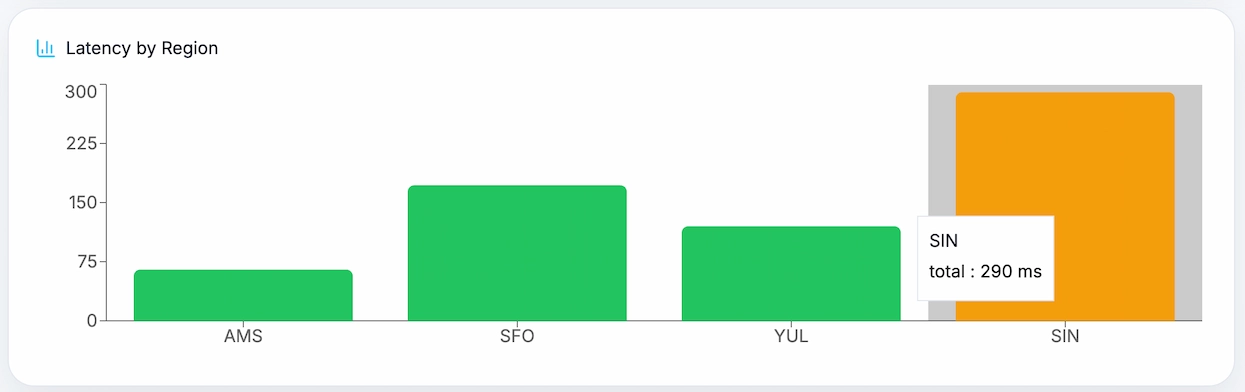
Region by region breakdown
Amsterdam was rock-solid: 63 ms typical, barely any variation. Montreal and San Francisco were slower but equally consistent. Singapore is where it gets interesting — 37 ms on a typical request, which is the fastest of any region, but occasionally jumping to 290 ms. That kind of gap means some users in Singapore get a great experience and others get a noticeably slow one, seemingly at random.
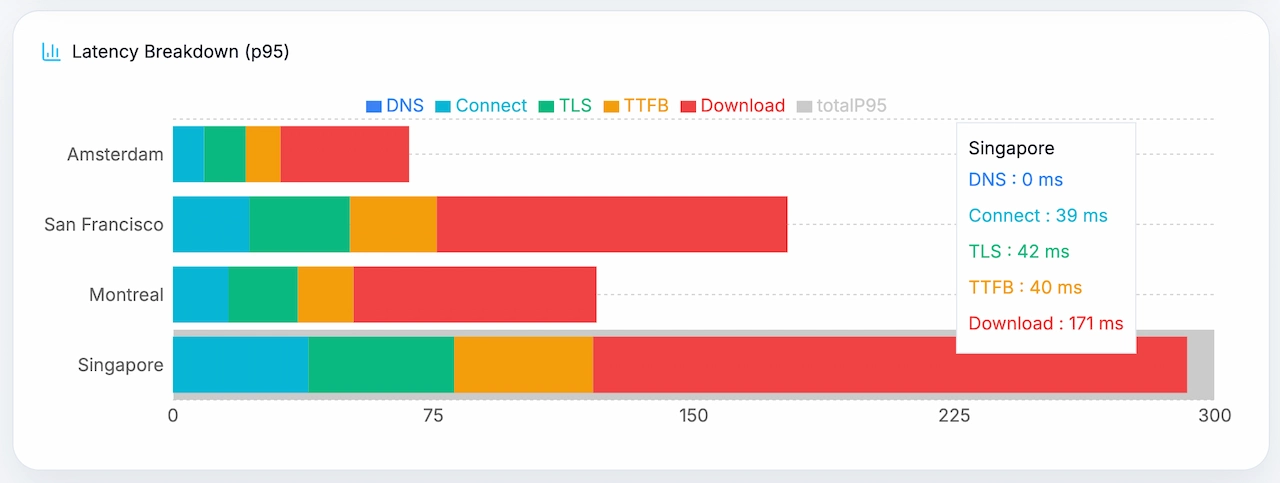
Where is the time actually going?
DNS lookup, connecting to the server, and the security handshake are all nearly instant — we're talking single-digit milliseconds in every region. Almost all the time is spent downloading the page content itself. That's actually a good sign: it means GitHub's servers respond quickly, and the time your users spend waiting is mostly their connection receiving data.
Region metrics
Start with the headline number for each city. Open the technical breakdown only if you want to see where that time is coming from.
Reference region
Amsterdam
20 requests · 100% successful
On a slower request
65 ms
Still fast
Consistency
Very consistent
Rare spike: 68 ms
Biggest delay: DownloadReliability: 100%
Technical breakdown
Region result
Montreal
20 requests · 100% successful
On a slower request
120 ms
Still fast
Consistency
Very consistent
Rare spike: 121 ms
Biggest delay: DownloadReliability: 100%
Technical breakdown
Region result
San Francisco
20 requests · 100% successful
On a slower request
172 ms
Noticeable
Consistency
Very consistent
Rare spike: 178 ms
Biggest delay: DownloadReliability: 100%
Technical breakdown
Fastest region
Singapore
20 requests · 100% successful
On a slower request
290 ms
Worth watching
Consistency
Can spike
Rare spike: 316 ms
Biggest delay: DownloadReliability: 100%
Technical breakdown
What stands out
- • 100% reliability — not a single failed request across all 4 regions.
- • Amsterdam had the most consistent results — barely any difference between a fast and slow request.
- • Singapore was usually the fastest city at 37 ms typical, but spiked to 290 ms on bad requests.
- • San Francisco was the slowest consistent region at around 169 ms — still totally usable.
- • The network setup was fast everywhere — the time is almost entirely spent downloading content.
Why 'on a bad day' matters more than the average
The typical load time tells you what most requests look like. But your users don't only make typical requests — they make all of them, including the slow ones. GitHub's Singapore result is a perfect example: the typical load is 37 ms, which looks great. But 1 in 20 requests takes 290 ms. Those are the requests users notice and remember. That's why we show both numbers.
How we ran this test
We made a standard page request to github.com from servers in 4 cities: Amsterdam, Montreal, San Francisco and Singapore. Each city ran 20 requests. We measured how long each step took — DNS lookup, connecting, security handshake, server response, and download — then calculated typical and worst-case times from the results.
Request type: standard page load
Cities tested: 4
Requests per city: 20
Total requests: 80
Max wait time before timeout: 20 seconds
How fast does your site load around the world?
Run a free speed test from multiple cities and find out where your users are waiting — no setup, no account required.