Speed Test
How fast is Google? Real-world speed from 4 regions
We loaded google.com from Amsterdam, Montreal, San Francisco and Singapore — 20 times each — and measured how long it actually took. Here's what real users in those cities would experience.
Independent measurement by LatencyRadar. Not affiliated with Google.
Quick take
Google is the gold standard for global infrastructure, and this test shows why. Every request came back successfully, load times were fast in every city, and there was barely any difference between a typical request and a slow one. If you want to know what a well-optimized global service looks like, this is the benchmark to compare against.
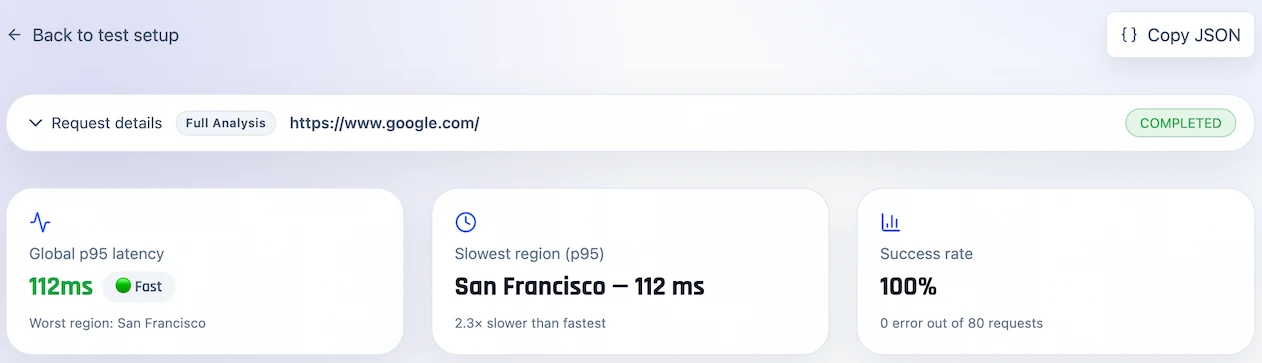
- • Loaded successfully every single time — 80 out of 80 requests
- • Typical load time across all regions: 47 ms — nearly instant
- • Even the slowest region on a bad day stayed under 115 ms
- • Singapore was the fastest city, Amsterdam close behind
The setup
A standard page load from four cities, repeated 20 times each. Google is a useful reference point precisely because it's one of the most optimized services on the internet — seeing how your own site or API compares to this result tells you a lot.
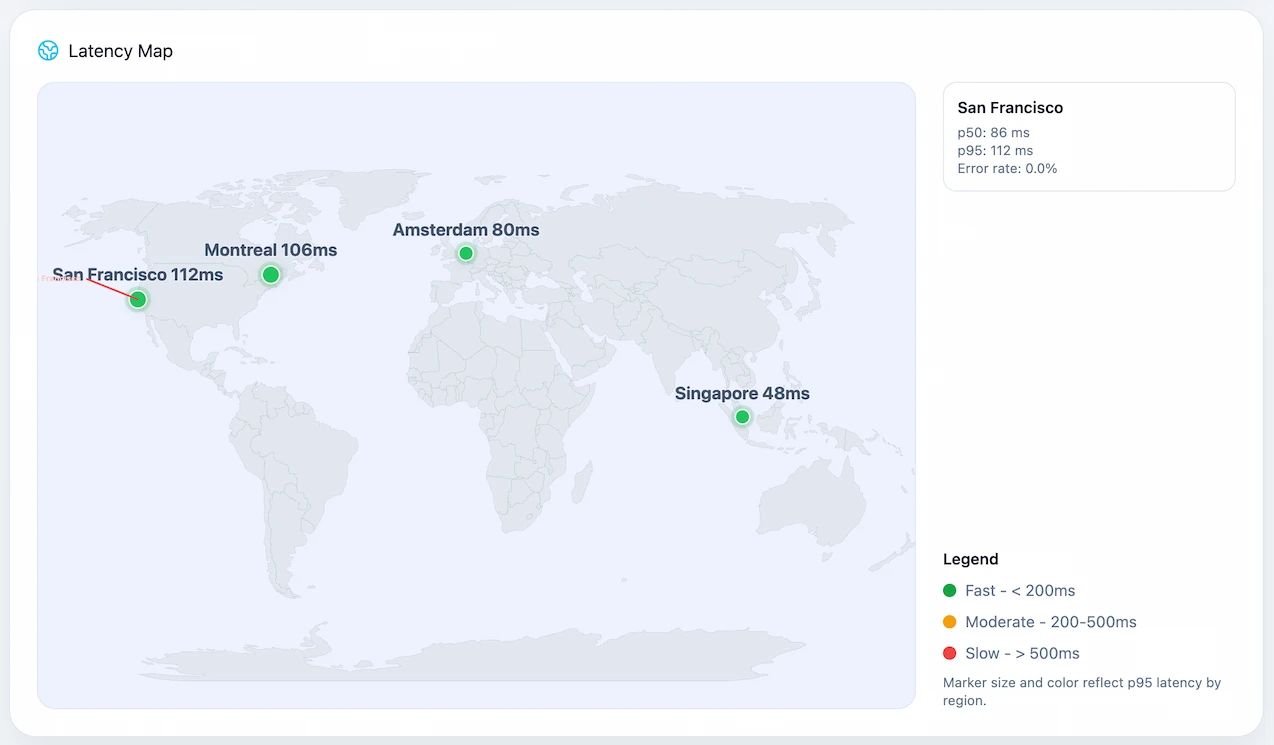
Where in the world is it fast?
Everywhere — but not equally. Singapore was the fastest city in this test, which is unusual and reflects Google's heavy infrastructure investment in Asia. Amsterdam was nearly as fast. Montreal and San Francisco were slower, though still well within what users would consider instant.
Region by region breakdown
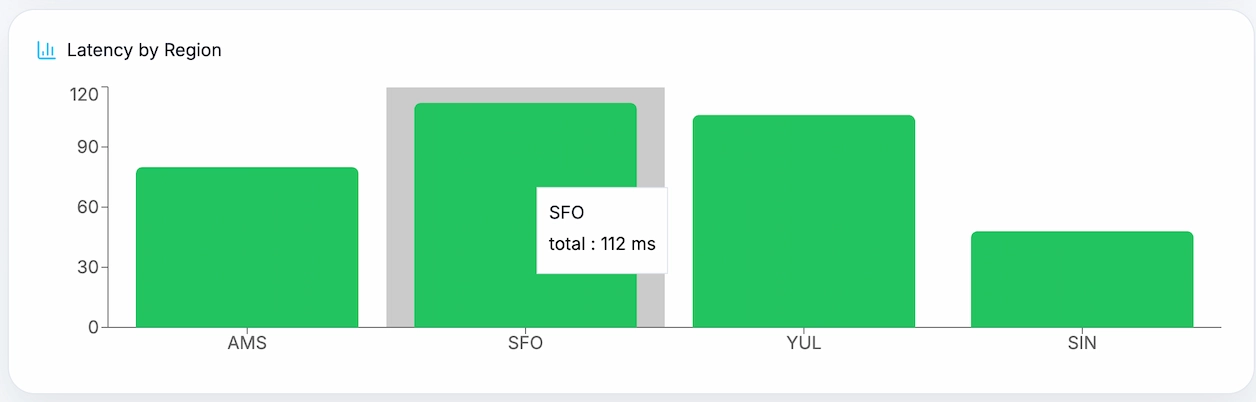
Singapore came in at 41 ms typical — the fastest of any region. Amsterdam was close at 47 ms. Montreal climbed to 78 ms and San Francisco to 86 ms. The most notable number is San Francisco's occasional spike to 577 ms — rare, but worth knowing if your users are on the US West Coast. Every other region was remarkably consistent.
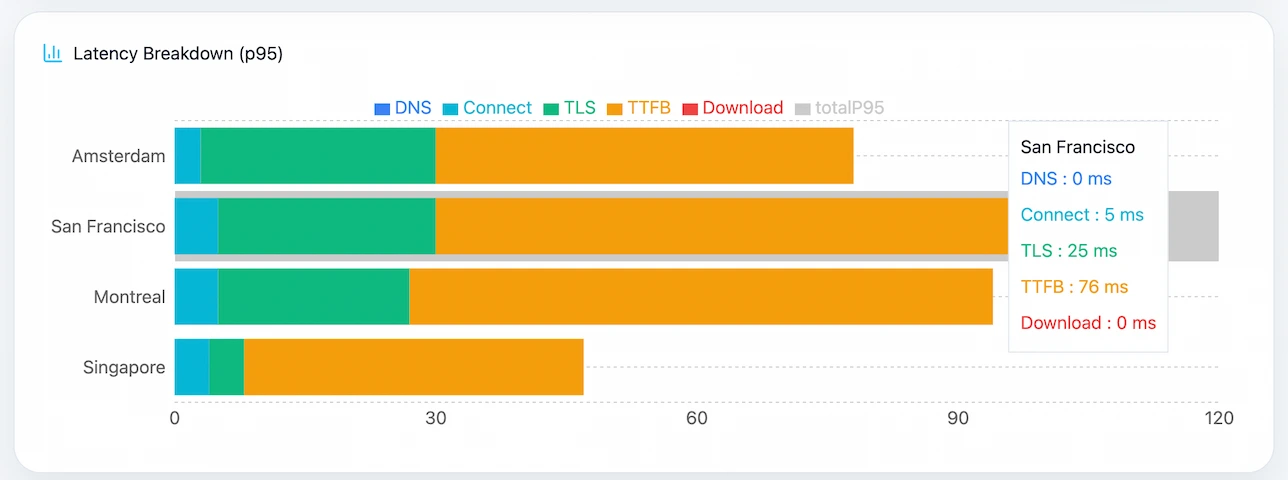
Where is the time actually going?
DNS lookup was effectively zero in every city — Google's name resolution is essentially instant globally. Most of the time is split between the security handshake and the server sending back the first byte of content. There's no download time to speak of, which makes sense for a search page that's designed to be as lightweight as possible.
Region metrics
Start with the headline number for each city. Open the technical breakdown only if you want to see where that time is coming from.
Reference region
Amsterdam
20 requests · 100% successful
On a slower request
80 ms
Still fast
Consistency
Mostly steady
Rare spike: 410 ms
Biggest delay: Server responseReliability: 100%
Technical breakdown
Region result
Montreal
20 requests · 100% successful
On a slower request
106 ms
Still fast
Consistency
Mostly steady
Rare spike: 211 ms
Biggest delay: Server responseReliability: 100%
Technical breakdown
Slowest region
San Francisco
20 requests · 100% successful
On a slower request
112 ms
Still fast
Consistency
Mostly steady
Rare spike: 577 ms
Biggest delay: Server responseReliability: 100%
Technical breakdown
Fastest region
Singapore
20 requests · 100% successful
On a slower request
48 ms
Feels instant
Consistency
Very consistent
Rare spike: 48 ms
Biggest delay: Server responseReliability: 100%
Technical breakdown
What stands out
- • 100% reliability — not a single failed request across all 4 regions.
- • Singapore was the fastest city at 41 ms typical — almost no variation between fast and slow requests.
- • San Francisco occasionally spiked to 577 ms, despite a 86 ms typical time — the one rough edge in an otherwise clean result.
- • Amsterdam delivered fast, rock-solid results at 47 ms typical with very little variation.
- • DNS lookup was instant everywhere — Google's global network handles name resolution before you'd even notice.
Why 'on a bad day' matters more than the average
The typical load time tells you what most requests look like. But users don't only make typical requests. San Francisco is a good example here — 86 ms is the typical load time, which feels fast. But 1 in 100 requests took 577 ms. That's the kind of occasional slowness that makes a site feel unreliable even when it's usually quick. We show both numbers so you get the full picture.
How we ran this test
We made a standard page request to google.com from servers in 4 cities: Amsterdam, Montreal, San Francisco and Singapore. Each city ran 20 requests. We measured how long each step took — DNS lookup, connecting, security handshake, and server response — then calculated typical and worst-case times from the results.
Request type: standard page load
Cities tested: 4
Requests per city: 20
Total requests: 80
Max wait time before timeout: 20 seconds
How does your site stack up against Google?
Run a free speed test from multiple cities and see how your load times compare — no setup, no account required.