Speed Test
How fast is Google Fonts? We tested Geist + Inter from 4 regions
Google Fonts is on millions of websites. Every page load that uses it makes a request to Google's servers before your text can appear. We tested a real font request — loading both Geist and Inter, exactly the kind of request a typical site makes — from Amsterdam, San Francisco, Montreal and Singapore, 20 times each.
Independent measurement by LatencyRadar. Not affiliated with Google.
Quick take
Google Fonts loaded fast most of the time — but Amsterdam had occasional spikes that are hard to ignore. Singapore and Amsterdam both clocked around 14–16 ms on a typical request, which is excellent. San Francisco and Montreal were slower at 66–80 ms typical, which is consistent with what we've seen in other Google benchmarks. The number that stands out is Amsterdam's worst-case time: nearly 2 full seconds on a single request. That's not a slow response — that's a font your users are staring at a blank page waiting for. It happened rarely, but it happened.
- • Loaded successfully every single time — 80 out of 80 requests
- • Singapore and Amsterdam: 14–16 ms typical — very fast
- • San Francisco and Montreal: 66–80 ms typical — noticeably slower
- • Amsterdam occasionally spiked to nearly 2 seconds — the one finding worth watching
The setup
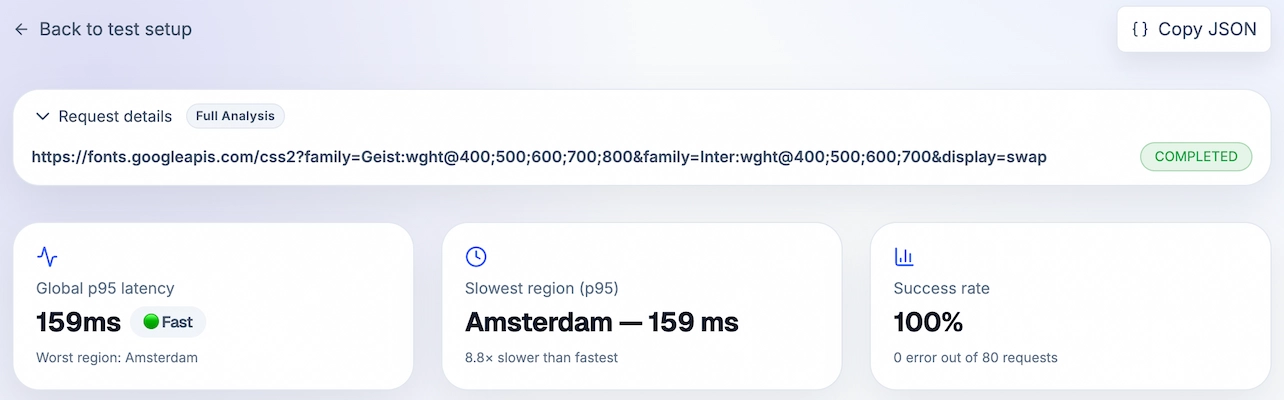
This is a real font request — the exact URL a browser sends when loading Geist and Inter from Google Fonts, with multiple weights for each. This is what millions of sites trigger on every page load, including LatencyRadar itself. All 80 requests came back with a 200 OK and actual font CSS — no 404s, no errors.
Where in the world is it fast?
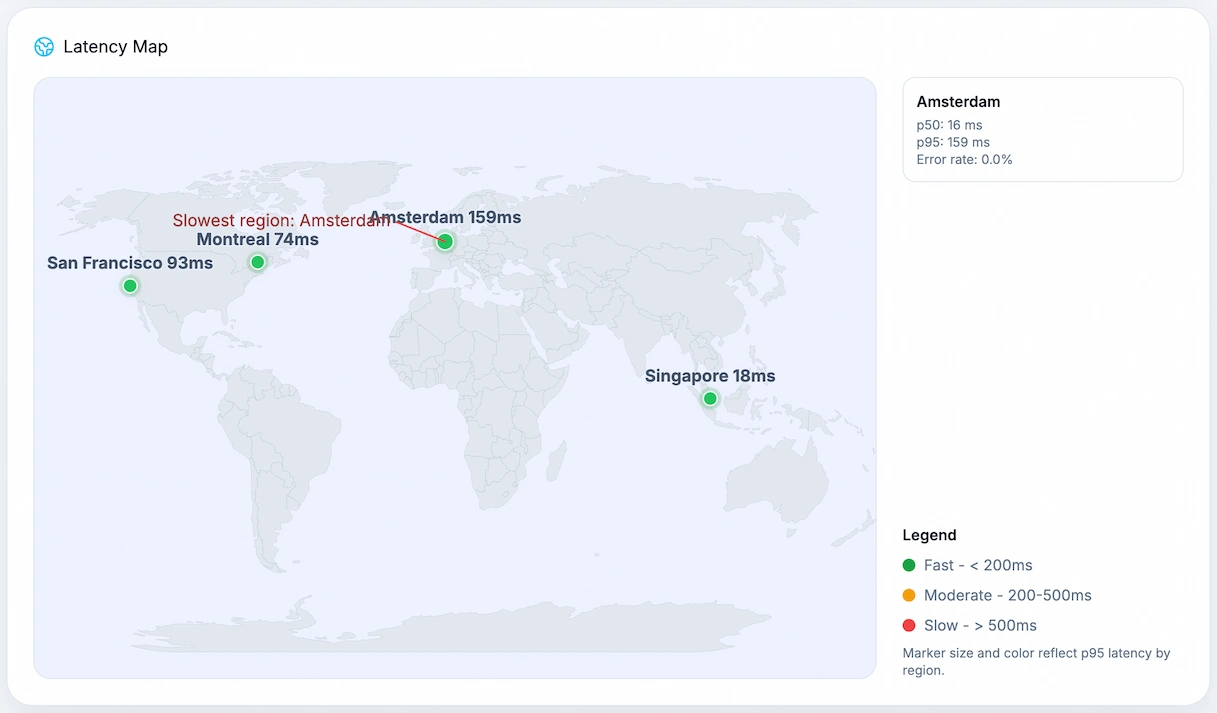
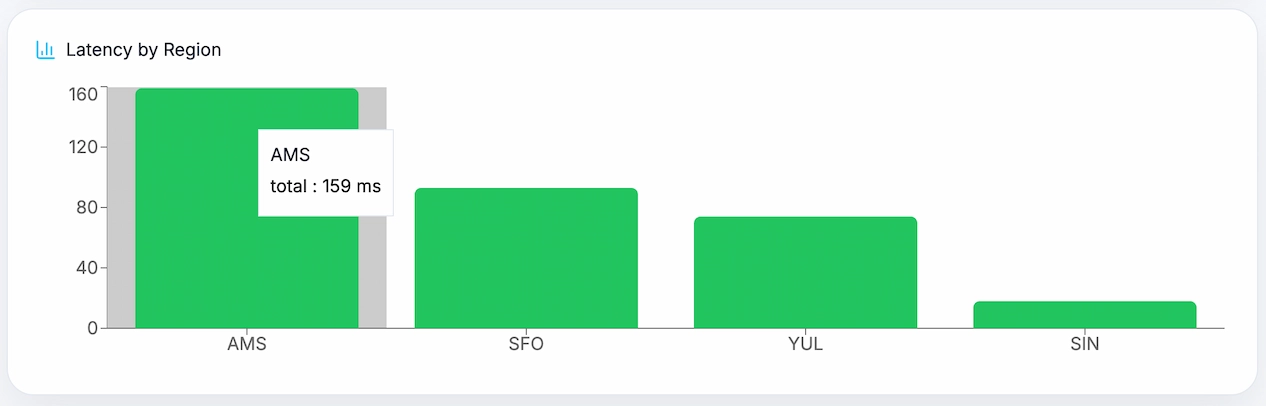
The split is almost identical to other Google services we've tested: Europe and Asia are very fast, North America is slower. Singapore loaded in 14 ms typical. Amsterdam was 16 ms typical. San Francisco came in at 80 ms and Montreal at 66 ms. The pattern points to Google having font CDN infrastructure closer to users in Europe and Asia than in North America, which is counterintuitive but consistent across multiple tests.
Region by region breakdown
Three cities were consistent and predictable. Singapore: 14 ms typical, 18 ms on a bad day — rock solid. Montreal: 66 ms typical, 95 ms worst case — slow but steady. San Francisco: 80 ms typical, 103 ms worst case — same pattern. Then there's Amsterdam: 16 ms typical, which is excellent, but a p95 of 159 ms and a worst-case of 1,749 ms. That's not a typo. One in every 20 requests from Amsterdam took between 159 ms and nearly 2 seconds, while the other 19 were under 20 ms. That kind of spread — fast almost always, occasionally very slow — is the hardest performance problem to debug, because it's invisible until a real user hits it.
Where is the time actually going?
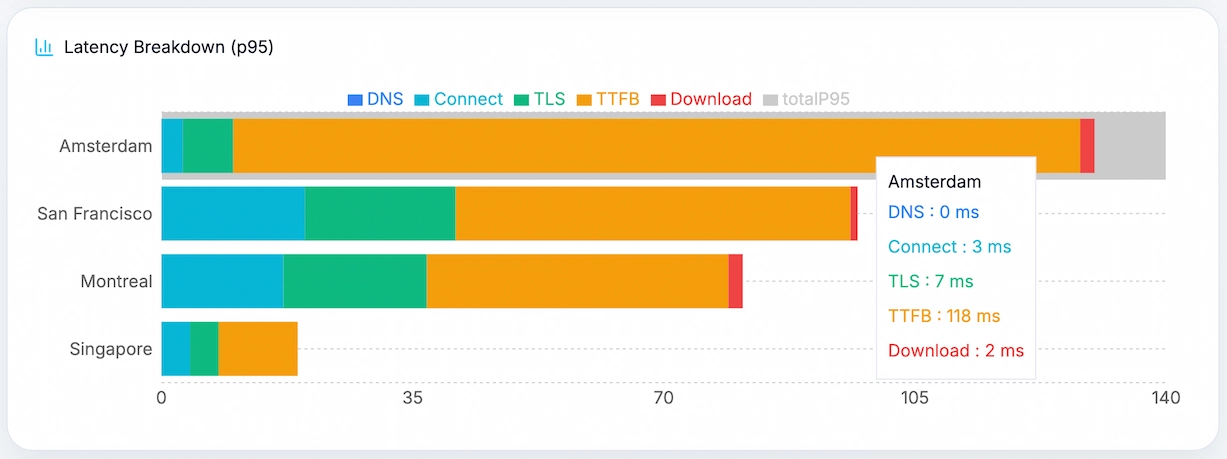
In Singapore, the entire request — connection, security handshake, server response, download — completes in under 18 ms. In San Francisco and Montreal, the connection and handshake alone take 30–40 ms before Google's server even starts responding. In Amsterdam, the connection is fast (under 3 ms), which makes the occasional 1,700 ms server response even stranger — the network isn't the problem, something in Google's response path from that edge location occasionally stalls. DNS was zero everywhere.
Region metrics
Start with the headline number for each city. Open the technical breakdown only if you want to see where that time is coming from.
Slowest region
Amsterdam
20 requests · 100% successful
On a slower request
159 ms
Noticeable
Consistency
Can spike
Rare spike: 1749 ms
Biggest delay: Server responseReliability: 100%
Technical breakdown
Region result
Montreal
20 requests · 100% successful
On a slower request
74 ms
Still fast
Consistency
Very consistent
Rare spike: 95 ms
Biggest delay: Server responseReliability: 100%
Technical breakdown
Region result
San Francisco
20 requests · 100% successful
On a slower request
93 ms
Still fast
Consistency
Very consistent
Rare spike: 103 ms
Biggest delay: Server responseReliability: 100%
Technical breakdown
Fastest region
Singapore
20 requests · 100% successful
On a slower request
18 ms
Feels instant
Consistency
Very consistent
Rare spike: 24 ms
Biggest delay: Server responseReliability: 100%
Technical breakdown
What stands out
- • Amsterdam is the headline: 16 ms typical, 159 ms p95, and a 1,749 ms p99 — a 109x gap between normal and worst-case.
- • Singapore was the fastest and most consistent city — 14 ms typical, never above 24 ms.
- • San Francisco and Montreal were consistently slower at 66–80 ms, but at least they were predictable.
- • The connection itself was fast everywhere — Amsterdam's spikes came almost entirely from the server response step.
- • All 80 requests returned 200 OK with real font CSS — no errors, no failures.
Why Amsterdam's spike matters even if it's rare
If 1 in 20 of your European users hits a 1,749 ms font delay, your page text is invisible for nearly 2 seconds for that user — while everything else on the page has already loaded. They see a blank or invisible text block, assume something is broken, and leave. It won't show up in your average load time metrics. It won't trigger an alert. You'll never know it happened unless you're specifically measuring worst-case times from European locations. That's exactly what this kind of test is for.
How we ran this test
We made a real Google Fonts CSS request — loading Geist (5 weights) and Inter (4 weights) — from servers in 4 cities: Amsterdam, San Francisco, Montreal and Singapore. Each city ran 20 requests. We measured how long each step took and calculated typical and worst-case times from the results. All requests returned HTTP 200 with valid font CSS.
Request type: real Google Fonts CSS request (Geist + Inter, multiple weights)
Cities tested: 4
Requests per city: 20
Total requests: 80
All requests returned HTTP 200 OK
Are Google Fonts stalling for your European users too?
This benchmark found Amsterdam requests that usually took 16 ms occasionally stretching to 1,749 ms. Run a test on your own site and see whether your European users are hitting the same kind of font delay.