Speed Test
How fast is the Stripe API? Real-world speed from 4 regions
We hit api.stripe.com from Amsterdam, Montreal, San Francisco and Singapore — 20 times each — and measured how long it actually took. Here's what your users would experience when your app talks to Stripe.
Independent measurement by LatencyRadar. Not affiliated with Stripe.
Quick take
If you're building a payments integration, this is reassuring news. Stripe's API was fast, reliable, and remarkably consistent in every city we tested. The typical response time was 51 ms globally, and even on a slow request it barely moved. Singapore was surprisingly the fastest — nearly instant at 13 ms. San Francisco was the slowest, but 87 ms on a bad day is still well within what users would consider seamless.
- • Loaded successfully every single time — 80 out of 80 requests
- • Typical response time: 51 ms — fast enough that users won't notice
- • Barely any difference between a fast and slow request — very consistent
- • Singapore was the fastest city at just 13 ms typical
The setup
A standard request to Stripe's API from four cities, repeated 20 times each. This is the kind of call your backend makes every time a user checks out — so the speed here directly affects how snappy your payment flow feels.
Where in the world is it fast?
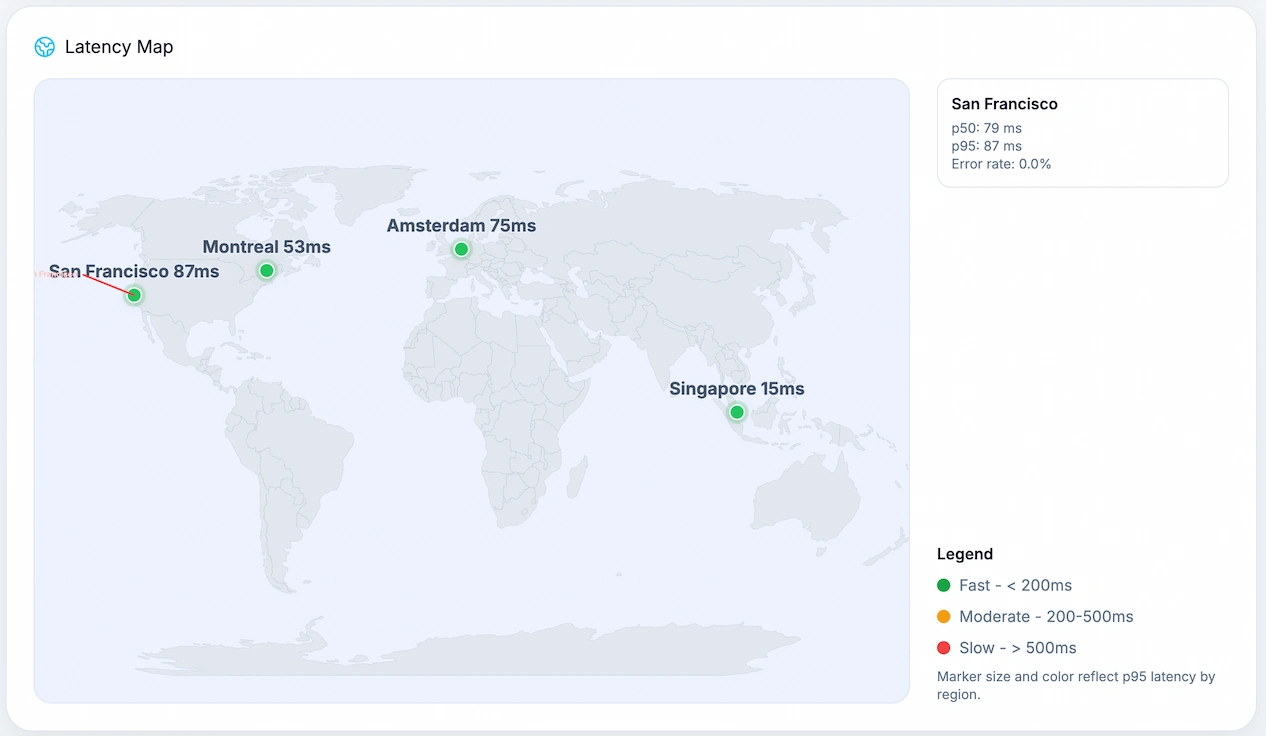
Fast everywhere, but Singapore stands out. At 13 ms typical, it's nearly 6x faster than the next closest region — which points to Stripe having a major infrastructure presence in Asia. If you're launching in Southeast Asia, your payment flow will feel instant. Montreal, Amsterdam and San Francisco are all well within the 'users won't notice' range.
Region by region breakdown
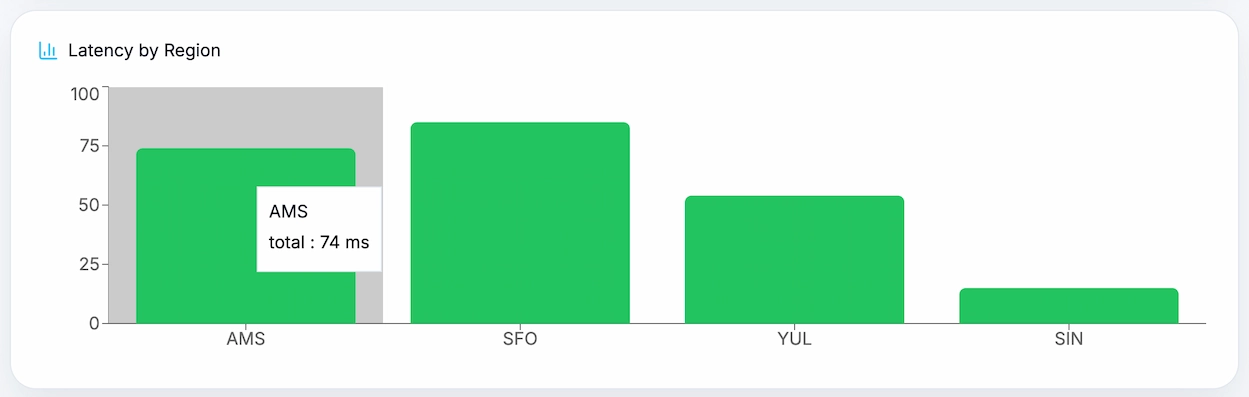
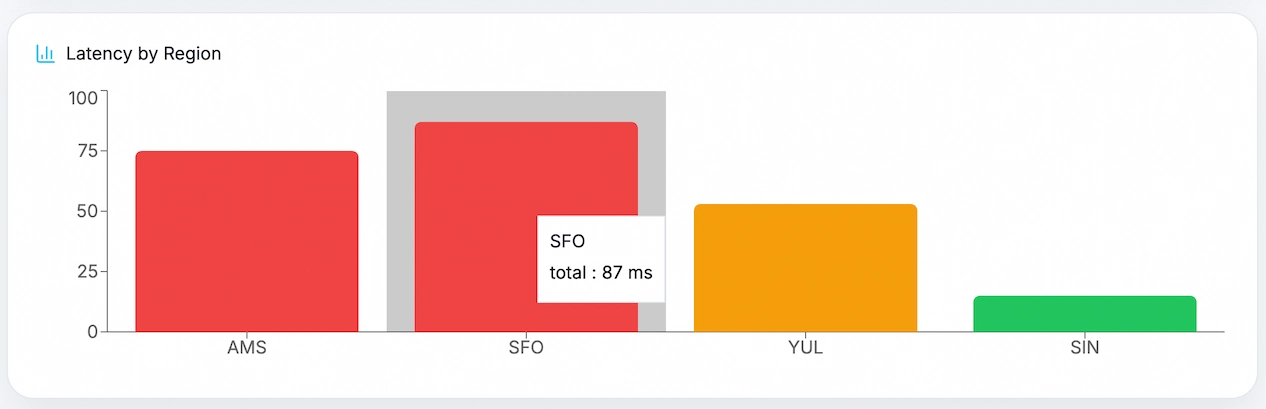
Singapore led at 13 ms typical with almost no variation — every single request came back in 15 ms or less. Montreal was next at 51 ms, Amsterdam at 70 ms, and San Francisco was slowest at 79 ms typical. The key takeaway: even the slowest region had almost no bad requests. San Francisco's worst case was 90 ms, which is still fast.
Where is the time actually going?
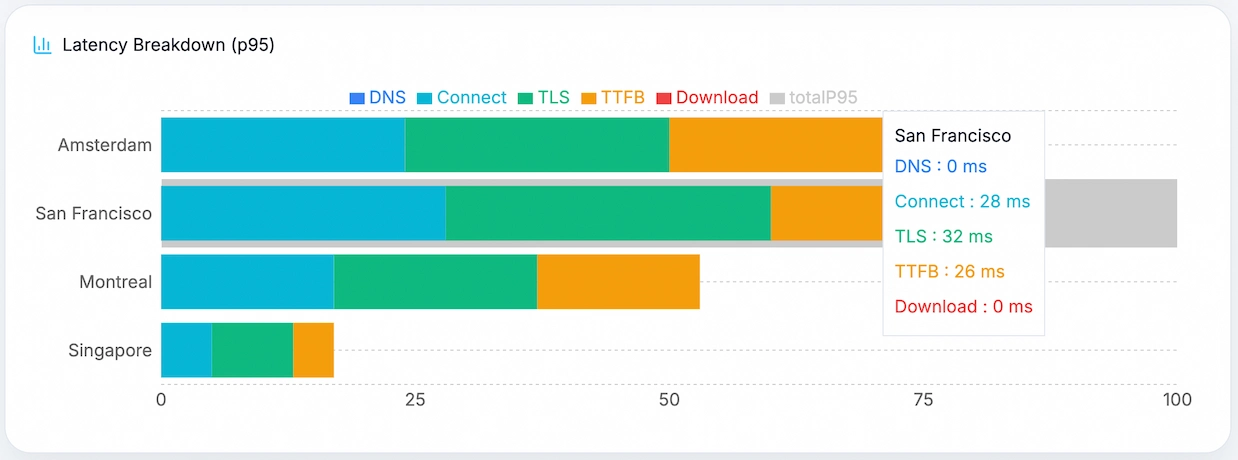
Almost none of the time is Stripe's servers thinking — the server response itself is nearly instant everywhere. Most of the time is spent on the connection setup and security handshake before the request even reaches Stripe. That's normal for a well-optimized API, and it means there's not much Stripe could do to make it faster — the remaining time is mostly physics.
Region metrics
Start with the headline number for each city. Open the technical breakdown only if you want to see where that time is coming from.
Reference region
Amsterdam
20 requests · 100% successful
On a slower request
75 ms
Still fast
Consistency
Very consistent
Rare spike: 75 ms
Biggest delay: TLSReliability: 100%
Technical breakdown
Region result
Montreal
20 requests · 100% successful
On a slower request
53 ms
Feels instant
Consistency
Very consistent
Rare spike: 54 ms
Biggest delay: TLSReliability: 100%
Technical breakdown
Slowest region
San Francisco
20 requests · 100% successful
On a slower request
87 ms
Still fast
Consistency
Very consistent
Rare spike: 90 ms
Biggest delay: TLSReliability: 100%
Technical breakdown
Fastest region
Singapore
20 requests · 100% successful
On a slower request
15 ms
Feels instant
Consistency
Very consistent
Rare spike: 15 ms
Biggest delay: TLSReliability: 100%
Technical breakdown
What stands out
- • 100% reliability — not a single failed request across all 4 regions.
- • Singapore was extraordinarily fast at 13 ms typical — every single request came back in under 15 ms.
- • San Francisco was the slowest region, but its worst request was still only 90 ms.
- • Stripe's servers respond almost instantly everywhere — the remaining time is connection and security setup.
- • This is one of the most consistent API results we've measured — barely any difference between fast and slow requests.
Why 'on a bad day' matters for payment APIs
When Stripe is slow, your checkout is slow — and slow checkouts lose sales. The typical response time tells you what most requests look like, but the 'on a bad day' number is what your users experience when things aren't perfect. For Stripe, that number is still fast. But for your own API sitting in front of it, the same question applies: how slow does it get when it's not having a great day?
How we ran this test
We made a standard request to api.stripe.com from servers in 4 cities: Amsterdam, Montreal, San Francisco and Singapore. Each city ran 20 requests. We measured how long each step took — DNS lookup, connecting, security handshake, server response, and download — then calculated typical and worst-case times from the results.
Request type: standard API request
Cities tested: 4
Requests per city: 20
Total requests: 80
Max wait time before timeout: 20 seconds
How fast is your API compared to Stripe?
Run a free speed test from multiple cities and find out where your users are waiting — no setup, no account required.