Speed Test
How fast is Supabase? Real-world speed from 4 regions
We loaded supabase.com from Amsterdam, Montreal, San Francisco and Singapore — 20 times each — and measured how long it actually took. If you're building on Supabase, here's what your users around the world would experience.
Independent measurement by LatencyRadar. Not affiliated with Supabase.
Quick take
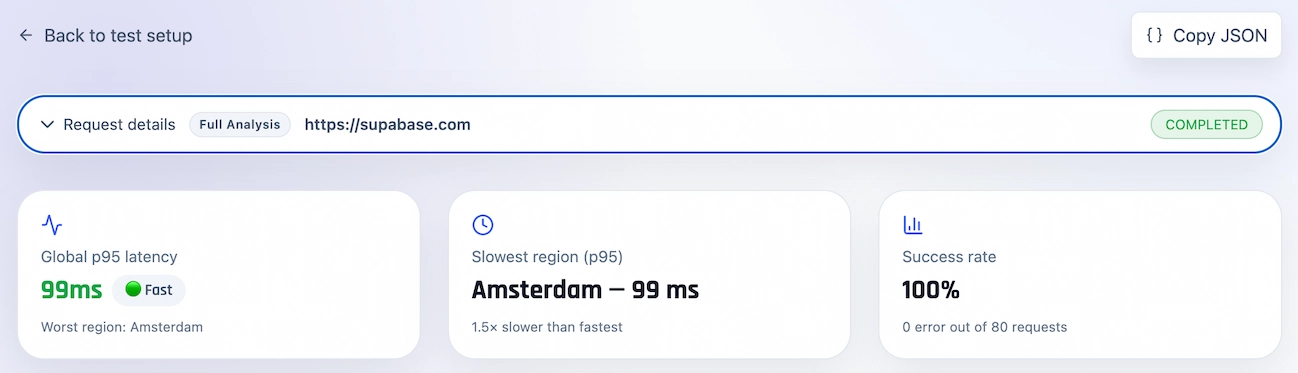
Supabase loaded fast and reliably in every city we tested. Every request came back successfully, and the typical load time was under 50 ms globally — comfortably in the 'users won't notice' range. The most interesting finding is how evenly matched all four regions were. Unlike a lot of services where one city is dramatically slower, Supabase stayed tight across the board.
- • Loaded successfully every single time — 80 out of 80 requests
- • Typical load time: 47 ms globally — fast in every city
- • All four regions stayed within 30 ms of each other — unusually consistent
- • Amsterdam had the occasional slow request, but nothing alarming
The setup
A standard page load from four cities, repeated 20 times each. Supabase is a popular backend platform for indie hackers and vibe coders, so knowing how fast it loads globally is useful whether you're building on it or just curious how it compares to the competition.
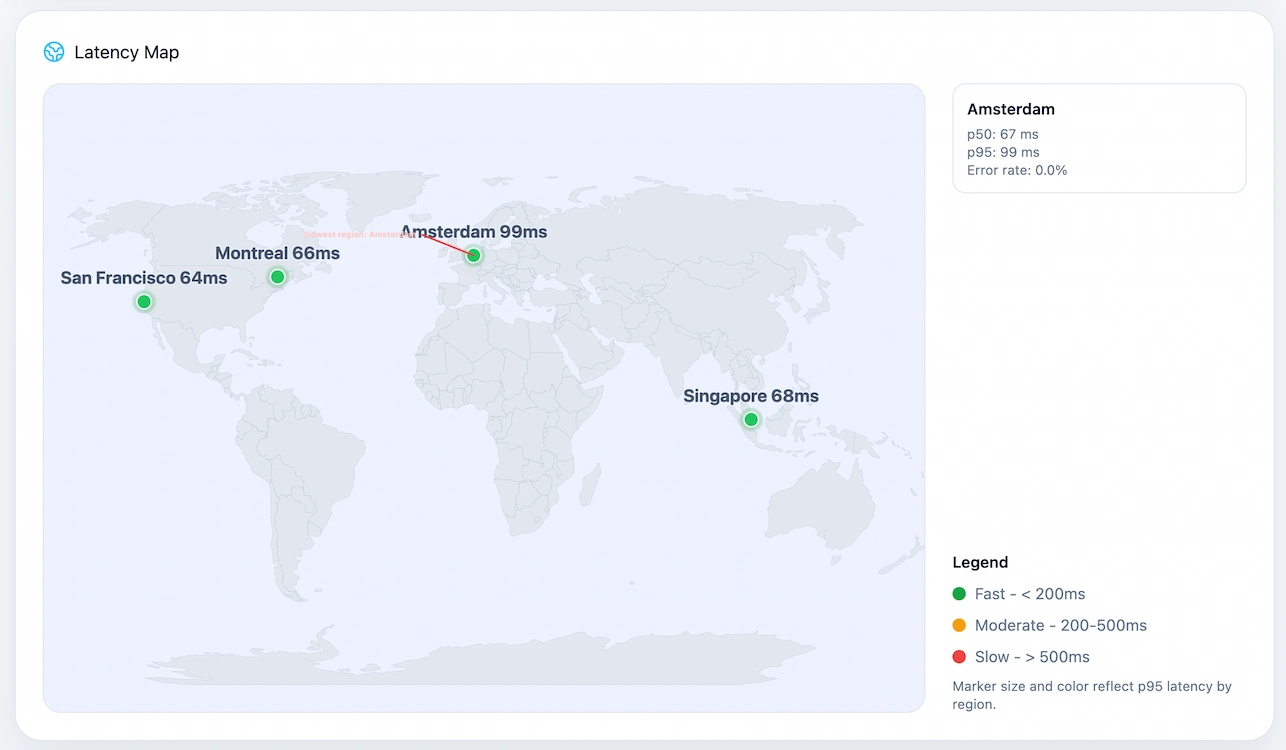
Where in the world is it fast?
Everywhere — and more evenly than most services we've tested. Montreal was the fastest at 41 ms, San Francisco and Singapore were nearly identical at 47–49 ms, and Amsterdam was slightly slower but still well under 100 ms. There's no region where Supabase feels noticeably slow.
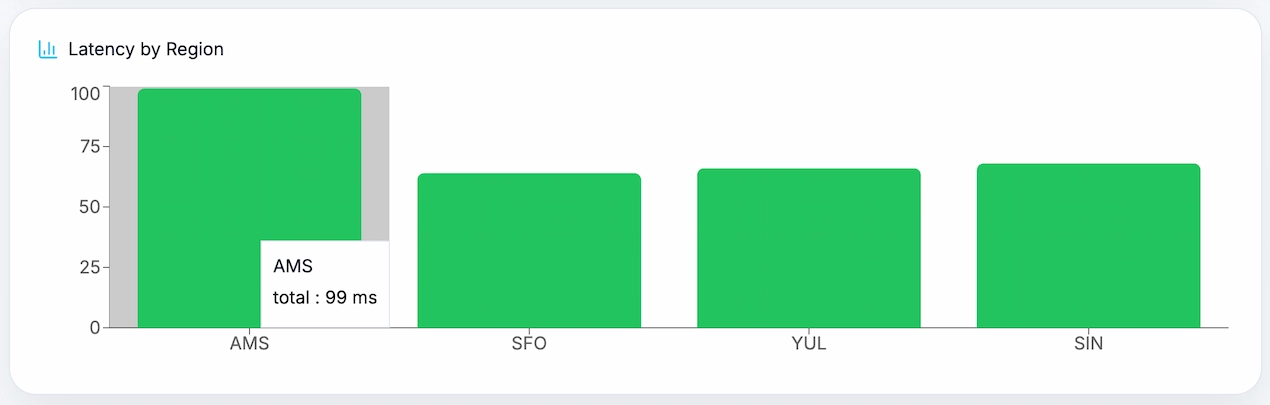
Region by region breakdown
Montreal came in fastest at 41 ms typical. San Francisco and Singapore were almost tied at 47 ms and 49 ms. Amsterdam was the slowest at 67 ms typical, and occasionally spiked to 354 ms on a bad request — that's the one number worth watching. Every other region was rock solid, with worst-case times staying well under 200 ms.
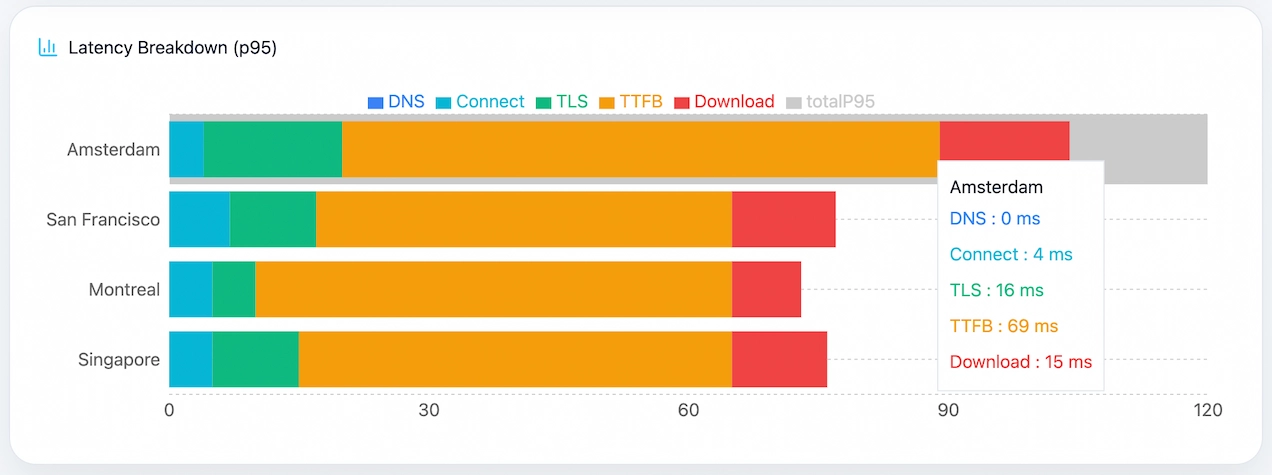
Where is the time actually going?
DNS lookup was instant in every city — not worth thinking about. Most of the time is split between the server preparing the response and the security handshake. That's a normal, healthy pattern for a well-run service. It means Supabase isn't wasting time on anything obvious — what you're seeing is just the physics of the network.
Region metrics
Start with the headline number for each city. Open the technical breakdown only if you want to see where that time is coming from.
Slowest region
Amsterdam
20 requests · 100% successful
On a slower request
99 ms
Still fast
Consistency
Mostly steady
Rare spike: 354 ms
Biggest delay: Server responseReliability: 100%
Technical breakdown
Fastest region
Montreal
20 requests · 100% successful
On a slower request
66 ms
Still fast
Consistency
Mostly steady
Rare spike: 199 ms
Biggest delay: Server responseReliability: 100%
Technical breakdown
Region result
San Francisco
20 requests · 100% successful
On a slower request
64 ms
Still fast
Consistency
Mostly steady
Rare spike: 74 ms
Biggest delay: Server responseReliability: 100%
Technical breakdown
Region result
Singapore
20 requests · 100% successful
On a slower request
68 ms
Still fast
Consistency
Mostly steady
Rare spike: 71 ms
Biggest delay: Server responseReliability: 100%
Technical breakdown
What stands out
- • 100% reliability — not a single failed request across all 4 regions.
- • All four cities stayed within 30 ms of each other — one of the most geographically even results we've seen.
- • Amsterdam was the only region with notable tail spikes, occasionally hitting 354 ms on a single request.
- • San Francisco and Singapore were nearly identical — both fast and consistent.
- • Server response time drives most of the latency — DNS and connection setup are negligible.
Why 'on a bad day' matters more than the average
The typical load time tells you what most requests look like. But every so often a request is slower — and that's the one your user notices. Amsterdam's typical time was 67 ms, which is fine. But occasionally it hit 354 ms. That's not a dealbreaker, but it's the kind of thing worth knowing before you assume your European users are having the same experience as everyone else.
How we ran this test
We made a standard page request to supabase.com from servers in 4 cities: Amsterdam, Montreal, San Francisco and Singapore. Each city ran 20 requests. We measured how long each step took — DNS lookup, connecting, security handshake, server response, and download — then calculated typical and worst-case times from the results.
Request type: standard page load
Cities tested: 4
Requests per city: 20
Total requests: 80
Max wait time before timeout: 20 seconds
How fast is your Supabase project compared to this?
This test measured supabase.com itself — but your actual database and API endpoints are a different story. Run a free speed test and find out where your users are really waiting.